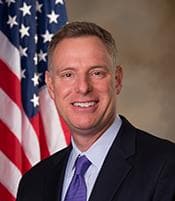
U.S. Representative
Scott H. Peters
California District 50
DemocratModerate Liberal
Contact
U.S. Representative
California District 50
Contact
Voting Profile
Most Active Policy Areas
102
Votes Analyzed
Data sources: voteview, congress.gov
Political Position
Representative Scott Peters positions himself as a moderate liberal within the Democratic Party, with a voting record that places him notably more conservative than the average House Democrat. His NOMINATE score of -0.193 suggests he occupies the centrist wing of his party, potentially making him more amenable to bipartisan positions on certain issues.
More conservative than the average Democrat (-0.38)
Data source: VoteView NOMINATE scores (UCLA/UC San Diego)
Policy Positions
102
total votes analyzed
Overview
Scott Peters represents California in the U.S. House as a Democrat who tends toward the moderate end of his party's spectrum. His voting patterns show a willingness to break from strict party-line positions, as evidenced by his placement significantly to the right of the average House Democrat. His legislative focus appears concentrated on healthcare issues, where he has cast the majority of his recorded votes. His 46% 'yea' rate on healthcare votes suggests a selective approach, supporting some healthcare measures while opposing others. On budget matters, he has shown a slightly higher tendency to vote in favor (56%), indicating pragmatic engagement with fiscal legislation. Peters has shown strong support for taxation and housing measures based on his limited recorded votes in these categories, while demonstrating more skepticism toward banking and finance legislation, where he voted 'nay' on all three recorded votes. His procedural voting pattern shows consistent opposition to Republican-led 'previous question' motions while supporting Democratic recommit motions, reflecting standard minority party tactics during his early tenure.
Key Positions
By Policy Area
Analysis updated: January 9, 2026
Campaign Finance
Includes all authorized campaign committees (principal committee, joint fundraising, and other authorized committees). Outside spending by Super PACs and independent groups is shown separately below. Verify on FEC.gov →
Career: $23.8M
Fundraising Over Time
Contribution Sources
24%
76%
0%
Individual Breakdown
Itemized (>$200)
$320K
Small Dollar (<$200)
$16K
Donation Sizes
Share of individual contribution dollars by donation size, current election cycle.
Where the Money Comes From
Itemized individual contributions only (donations over $200 report the donor's state). Small-dollar donations are not included because the FEC does not itemize them.
Top Contributors
Top Contributing Industries
Top Donor Employers
Employer as self-reported by itemized donors. “Not Employed” and “Self-Employed” typically rank highest for small-dollar campaigns and include retirees.
Where the Money Goes
Spending by Purpose
Purpose categories are self-reported on FEC filings; large “Other” totals are common.
Top Payees
DCCC
MOLLY ALLEN ASSOCIATES LLC
SAN DIEGO COUNTY DEMOCRATIC PARTY
CAPITAL STRATEGIES
GUSTO
TRUONG, JASMINE
BLUE WAVE POLITICAL PARTNERS
ALG POLLING, INC. DBA IMPACT RESEARCH INC.
Detailed Breakdown
Expenditures
Operating Costs
$894K
Operating Offsets
$10K
Net Operating
$884K
Refunds
Individual Refunds
$4K
Committee Refunds
$1K
Outside Spending (Super PACs)
Supporting
$720K
Opposing
$13.1M
Total Outside Spending
$13.9M
Top Outside Spenders
NRCC
AMERICANS FOR TAX REFORM
CONGRESSIONAL LEADERSHIP FUND
AMERICAN HOSPITAL ASSOCIATION PAC
JOBS OPPORTUNITY AND FREEDOM POLITICAL ACTION COMMITTEE - JOFPAC
VETERANS AID PAC INC
PROGRESSIVE KICK INDEPENDENT EXPENDITURES
CENTER FORWARD COMMITTEE
Independent expenditures are made without coordination with the candidate. Source: FEC Schedule E filings.
Voting Record
95 votes across 10 categories