U.S. Representative
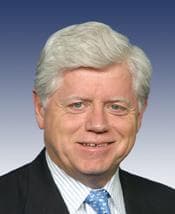
John B. Larson
Connecticut District 1
DemocratProgressive
Contact
U.S. Representative
Connecticut District 1
Contact
Voting Profile
Most Active Policy Areas
270
Votes Analyzed
Data sources: voteview, congress.gov
Political Position
Representative Larson's voting record places him in the progressive wing of the Democratic Party, with an ideology score slightly more liberal than the average House Democrat. His positions generally align with mainstream Democratic priorities on social programs and government services.
Near the average for Democrats (-0.38)
Data source: VoteView NOMINATE scores (UCLA/UC San Diego)
Policy Positions
270
total votes analyzed
Overview
John B. Larson is a long-serving Democratic Representative from Connecticut who has been in Congress since 1999. His voting record reflects consistent support for Democratic legislative priorities, particularly in areas of healthcare policy and government spending. With nearly 50% support on healthcare-related votes and a 59% approval rate on budget matters, Larson has demonstrated a focus on fiscal and social welfare issues. His high support rate (82%) on defense-related votes suggests he takes a moderate stance on national security matters compared to some members of his party. Larson's extensive voting history spanning over two decades shows a legislator who has remained consistently aligned with his party's positions while occasionally diverging on specific procedural matters, as evidenced by his mixed voting patterns on motions and amendments.
Key Positions
By Policy Area
Analysis updated: January 9, 2026
Campaign Finance
Includes all authorized campaign committees (principal committee, joint fundraising, and other authorized committees). Outside spending by Super PACs and independent groups is shown separately below. Verify on FEC.gov →
Career: $21.7M
Fundraising Over Time
Contribution Sources
54%
46%
Individual Breakdown
Itemized (>$200)
$1.3M
Small Dollar (<$200)
$133K
Donation Sizes
Share of individual contribution dollars by donation size, current election cycle.
Where the Money Comes From
Itemized individual contributions only (donations over $200 report the donor's state). Small-dollar donations are not included because the FEC does not itemize them.
Top Contributors
Top Contributing Industries
Top Donor Employers
Employer as self-reported by itemized donors. “Not Employed” and “Self-Employed” typically rank highest for small-dollar campaigns and include retirees.
Where the Money Goes
Spending by Purpose
Purpose categories are self-reported on FEC filings; large “Other” totals are common.
Top Payees
NUTMEG STRATEGIES
THRESHOLD GROUP, INC.
AMERICAN EXPRESS
ADVANCED NETWORK STRATEGIES, LLC
GQR
BUYING TIME LLC
ANTICIPATE PUBLIC AFFAIRS
PERKINS COIE
Detailed Breakdown
Expenditures
Operating Costs
$2.1M
Operating Offsets
$6K
Net Operating
$2.1M
Refunds
Individual Refunds
$9K
Committee Refunds
$6K
Outside Spending (Super PACs)
Supporting
$2K
Opposing
$135
Total Outside Spending
$2K
Top Outside Spenders
CT WORKING FAMILIES FEDERAL PAC D/B/A TAKE BACK CONGRESS CT
SIERRA CLUB POLITICAL COMMITTEE
PLANNED PARENTHOOD VOTES
NATIONAL ABORTION AND REPRODUCTIVE RIG
INTERNATIONAL ASSOCIATION OF FIREFIGHTERS INTERESTED IN REGISTRATION AND EDUCATION PAC
NEA ADVOCACY FUND
SIERRA CLUB INDEPENDENT ACTION
PLANNED PARENTHOOD ACTION FUND INC
Independent expenditures are made without coordination with the candidate. Source: FEC Schedule E filings.
Voting Record
270 votes across 12 categories