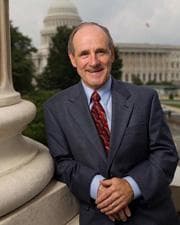
U.S. Senator
James E. Risch
Idaho
RepublicanConservative
Contact
U.S. Senator
Idaho
Contact
Voting Profile
Most Active Policy Areas
266
Votes Analyzed
Data sources: voteview, congress.gov
Political Position
Senator Risch holds conservative positions that place him slightly to the right of the average Republican senator. His voting record reflects traditional conservative priorities including fiscal restraint, limited government intervention, and strong support for agricultural interests important to his home state of Idaho.
Near the average for Republicans (0.52)
Data source: VoteView NOMINATE scores (UCLA/UC San Diego)
Policy Positions
266
total votes analyzed
Overview
James E. Risch has served as a U.S. Senator from Idaho since 2009, bringing a consistently conservative voting approach to the chamber. His record shows strong support for agricultural legislation, reflecting Idaho's significant farming and ranching economy, with 78% support in that category. Senator Risch's voting patterns show more cautious approaches to healthcare legislation, where he has supported about half of measures that came before him, and social security measures, where his 30% support rate suggests preference for limited expansion of these programs. His budget and taxation votes show 100% support, though the sample size is small. His environmental and energy votes show 61% support, indicating some flexibility in this policy area. On defense matters, his voting is evenly split, suggesting case-by-case evaluation of military and national security legislation rather than a blanket approach.
Key Positions
By Policy Area
Analysis updated: January 9, 2026
Campaign Finance
Includes all authorized campaign committees (principal committee, joint fundraising, and other authorized committees). Outside spending by Super PACs and independent groups is shown separately below. Verify on FEC.gov →
Career: $14.3M
Fundraising Over Time
Contribution Sources
66%
32%
2%
Individual Breakdown
Itemized (>$200)
$2.4M
Small Dollar (<$200)
$216K
Donation Sizes
Share of individual contribution dollars by donation size, current election cycle.
Where the Money Comes From
Itemized individual contributions only (donations over $200 report the donor's state). Small-dollar donations are not included because the FEC does not itemize them.
Top Contributors
Top Contributing Industries
Top Donor Employers
Employer as self-reported by itemized donors. “Not Employed” and “Self-Employed” typically rank highest for small-dollar campaigns and include retirees.
Where the Money Goes
Spending by Purpose
Purpose categories are self-reported on FEC filings; large “Other” totals are common.
Top Payees
RMC LLC
THE ENDICOTT GROUP
CHASE CARD SERVICES
GEN2 SOLUTIONS, LLC
AUTOSORT
RESPONSE AMERICA LLC
POLITICAL ADMINISTRATIVE SVCS.
CAXTON
Detailed Breakdown
Expenditures
Operating Costs
$3.0M
Operating Offsets
$697.6
Net Operating
$3.0M
Refunds
Individual Refunds
$91K
Committee Refunds
$44K
Outside Spending (Super PACs)
Supporting
$54K
Opposing
$2K
Total Outside Spending
$56K
Top Outside Spenders
IDAHO REPUBLICAN PARTY
NATIONAL RIGHT TO LIFE POLITICAL ACTION COMMITTEE
EVERYTOWN FOR GUN SAFETY ACTION FUND
VOTE LOCAL VOTE BLUE
NATIONAL RIFLE ASSOCIATION OF AMERICA POLITICAL VICTORY FUND
HUNTER ACTION FUND (HAF)
CONSERVATIVES OF
THE 60 PLUS ASSOCIATION
Independent expenditures are made without coordination with the candidate. Source: FEC Schedule E filings.
Voting Record
179 votes across 12 categories