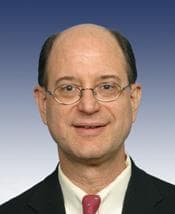
U.S. Representative
Brad Sherman
California District 32
DemocratProgressive
Contact
U.S. Representative
California District 32
Contact
Voting Profile
Most Active Policy Areas
275
Votes Analyzed
Data sources: voteview, congress.gov
Political Position
Brad Sherman is a progressive Democrat whose voting record places him slightly more toward the center compared to the average House Democrat. His NOMINATE score of -0.344 indicates consistent liberal positions while occasionally departing from the most progressive wing of his party on certain issues.
Near the average for Democrats (-0.38)
Data source: VoteView NOMINATE scores (UCLA/UC San Diego)
Policy Positions
275
total votes analyzed
Overview
Representative Brad Sherman has served in the U.S. House representing California with a voting record spanning over two decades. His legislative activity shows particular engagement with healthcare policy, budget matters, and agricultural issues, reflecting both his district's interests and his committee work. Sherman's voting patterns demonstrate strong support for defense-related measures, with an 83% favorable vote rate in that category. His healthcare voting shows more selectivity, supporting approximately half of the measures that came before him, suggesting careful evaluation of individual bills rather than blanket approval or opposition. On financial matters, Sherman has been more cautious, voting in favor of only one-third of banking and finance bills. This selective approach may reflect concerns about specific regulatory frameworks or consumer protection considerations. His budget votes show moderate support at 58%, indicating willingness to work within fiscal frameworks while maintaining priorities.
Key Positions
By Policy Area
Analysis updated: January 9, 2026
Campaign Finance
Includes all authorized campaign committees (principal committee, joint fundraising, and other authorized committees). Outside spending by Super PACs and independent groups is shown separately below. Verify on FEC.gov →
Career: $27.2M
Fundraising Over Time
Contribution Sources
67%
33%
Individual Breakdown
Itemized (>$200)
$1.4M
Small Dollar (<$200)
$11K
Donation Sizes
Share of individual contribution dollars by donation size, current election cycle.
Where the Money Comes From
Itemized individual contributions only (donations over $200 report the donor's state). Small-dollar donations are not included because the FEC does not itemize them.
Top Contributors
Top Contributing Industries
Top Donor Employers
Employer as self-reported by itemized donors. “Not Employed” and “Self-Employed” typically rank highest for small-dollar campaigns and include retirees.
Where the Money Goes
Spending by Purpose
Purpose categories are self-reported on FEC filings; large “Other” totals are common.
Top Payees
JACOBSON & ZILBER STRATEGIES LLC
NM MARKETING
TKO PUBLIC AFFAIRS
THE FROST GROUP LLC
FAIRBANK, MASLIN, MAULLIN
STONES' PHONES
THE HOUSE OF PRINTING, INC.
CITI CARD
Detailed Breakdown
Expenditures
Operating Costs
$3.7M
Net Operating
$3.7M
Refunds
Individual Refunds
$5
Committee Refunds
$5K
Outside Spending (Super PACs)
Supporting
$4.1M
Opposing
$17K
Total Outside Spending
$4.1M
Top Outside Spenders
NATIONAL ASSOCIATION OF REALTORS CONGRESSIONAL FUND
NATIONAL ASSOCIATION OF REALTORS POLITICAL ACTION COMMITTEE
CALIFORNIANS FOR INTERGITY IN GOVERNMENT
CITIZENS FOR PROSPERITY AND GOOD GOVERNMENT
NATIONAL ABORTION AND REPRODUCTIVE RIGHTS ACTION LEAGUE PAC
VENTURA COUNTY DEPUTY SHERIFFS' ASSOCIATION PAC (VCDSA PAC)
POLITICAL ACTION COUNCIL OF EDUCATORS(UNITED TEACHERS-LOS ANGELES)
COURAGE CALIFORNIA SUPER PAC
Independent expenditures are made without coordination with the candidate. Source: FEC Schedule E filings.
Voting Record
275 votes across 12 categories