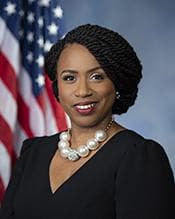
U.S. Representative
Ayanna Pressley
Massachusetts District 7
DemocratProgressive
Contact
U.S. Representative
Massachusetts District 7
Contact
Voting Profile
Most Active Policy Areas
49
Votes Analyzed
Data sources: voteview, congress.gov
Political Position
Representative Pressley's voting record places her in the progressive wing of the Democratic Party, with a NOMINATE score of -0.373. While classified as progressive, her score is very close to the Democratic Party average of -0.380, indicating she votes largely in line with her party's mainstream positions.
Near the average for Democrats (-0.38)
Data source: VoteView NOMINATE scores (UCLA/UC San Diego)
Policy Positions
49
total votes analyzed
Overview
Ayanna Pressley represents Massachusetts in the U.S. House of Representatives and has established herself as a consistent progressive voice in Congress. Her voting patterns show strong alignment with Democratic Party positions across multiple policy areas. Based on her recorded votes, Representative Pressley has been particularly active on healthcare legislation, casting 32 votes in this category with a 66% support rate for measures that came before her. Her budget-related votes show more selectivity, with a 44% support rate across 9 votes, suggesting she evaluates fiscal legislation on a case-by-case basis. Her procedural votes, including multiple votes on 'Ordering the Previous Question' and supporting resolutions, demonstrate consistent participation in House floor activities and alignment with Democratic leadership on parliamentary matters.
Key Positions
By Policy Area
Analysis updated: January 9, 2026
Campaign Finance
Includes all authorized campaign committees (principal committee, joint fundraising, and other authorized committees). Outside spending by Super PACs and independent groups is shown separately below. Verify on FEC.gov →
Career: $7.7M
Fundraising Over Time
Contribution Sources
93%
7%
Individual Breakdown
Itemized (>$200)
$622K
Small Dollar (<$200)
$314K
Donation Sizes
Share of individual contribution dollars by donation size, current election cycle.
Where the Money Comes From
Itemized individual contributions only (donations over $200 report the donor's state). Small-dollar donations are not included because the FEC does not itemize them.
Top Contributors
Top Contributing Industries
Top Donor Employers
Employer as self-reported by itemized donors. “Not Employed” and “Self-Employed” typically rank highest for small-dollar campaigns and include retirees.
Where the Money Goes
Spending by Purpose
Purpose categories are self-reported on FEC filings; large “Other” totals are common.
Top Payees
PAYROLL DATA PROCESSING
BLUE STATE DIGITAL
AMERICAN EXPRESS
NGP VAN, INC.
MBA CONSULTING GROUP
ACTBLUE TECHNICAL SERVICES
SCALE TO WIN
CAPITAL AREA TRANSPORTATION & EXECUTIVE SERVICES, LLC
Detailed Breakdown
Expenditures
Operating Costs
$1.1M
Operating Offsets
$4K
Net Operating
$1.1M
Refunds
Individual Refunds
$22K
Outside Spending (Super PACs)
Supporting
$187K
Opposing
$295K
Total Outside Spending
$482K
Top Outside Spenders
HONORING AMERICAN LAW ENFORCEMENT PAC
LAW ENFORCEMENT FOR A SAFER AMERICA PAC
SUPERMAJORITY PAC
INDIVISIBLE PROJECT INC.
WE DECIDE
32BJ UNITED AMERICAN DREAM FUND
IBEW 103
THE COLLECTIVE SUPER PAC
Independent expenditures are made without coordination with the candidate. Source: FEC Schedule E filings.
Voting Record
46 votes across 6 categories